
Please fill out the form below to request a quote or to request more information about us. please be as detailed as possible in your message, and we will get back to you as soon as possible with a response. we're ready to start working on your new project, contact us now to get started.
Expert in Water Quality Measurement and Water Treatment Project Since 2007
What Role Does User Interface Play in Blue Green Algae Analyzers
2025-10-07
BOQU
34
Blue green algae, or cyanobacteria, are microscopic organisms that can proliferate in water bodies, leading to harmful algal blooms (HABs). These blooms can produce toxins that pose significant risks to both aquatic life and human health. Accurate and efficient monitoring of HABs is crucial for maintaining water quality and ensuring public safety.
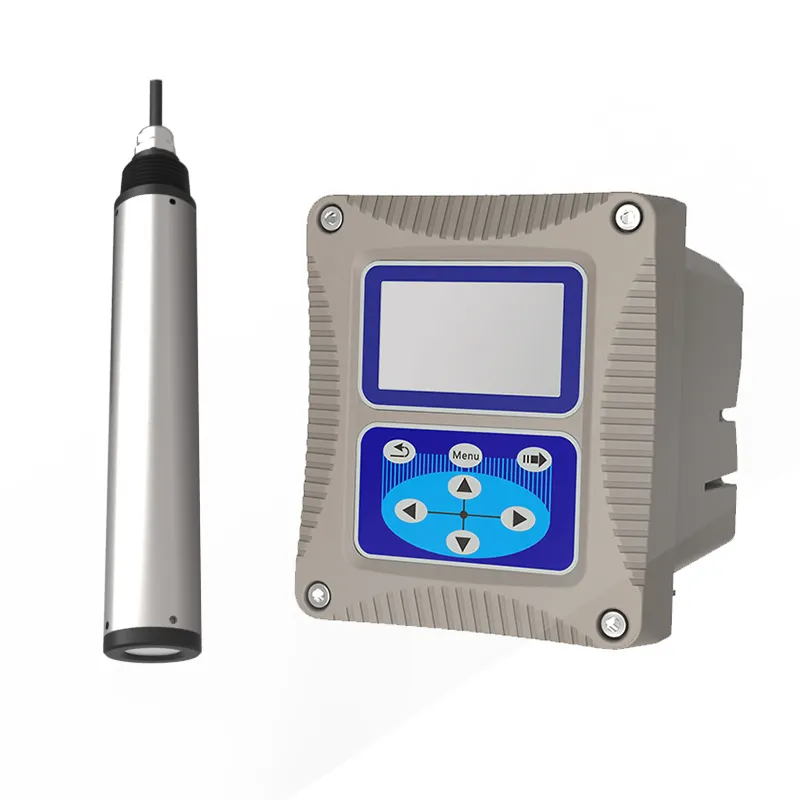
Blue green algae analyzers are essential tools for detecting and quantifying these harmful organisms. These devices provide real-time data on algae concentrations, enabling environmental agencies and stakeholders to take timely action. The primary function of these analyzers is to detect the presence and concentration of blue green algae in water samples. They use various methods, such as spectroscopy or colorimetric detection, to achieve this.
Spectroscopy is a method of measuring light absorption to determine concentrations, while colorimetric detection involves using colored reagents to quantify the algae. The user interface plays a pivotal role in the overall functionality of these analyzers. It serves as the bridge between the hardware and the user, providing a means to input data, display results, and manage the analyzer's operations. A well-designed user interface ensures that users can efficiently and accurately interpret the data, leading to better environmental management decisions.
User Interface Design Principles for Blue Green Algae Analyzers
Designing an intuitive and user-friendly user interface is critical for the effective use of blue green algae analyzers. Key design principles include:
- Intuitive Navigation: The interface should be easy to navigate, allowing users to quickly and seamlessly access the features they need. This is particularly important for field workers who may not have extensive technical expertise.
Clear and Concise Data Visualization: Data should be displayed in a clear and understandable manner. This includes graphical representations such as charts and graphs, as well as numerical data that is easy to read and interpret.
Color Schemes: Appropriate color schemes can help convey information quickly and effectively. For example, different shades of green can be used to represent varying concentrations of algae, making it easy to identify trends and anomalies.
Impact of User Interface on Data Interpretation
A well-designed user interface can significantly enhance the accuracy and speed of data interpretation. In a field study conducted by the Environmental Protection Agency (EPA), researchers found that analyzers with more intuitive user interfaces led to faster and more accurate data interpretation. This improvement was attributed to the ease of navigation and clear data presentation, which minimized the chances of errors and misinterpretations.
User Interface in Automated vs. Manual Analysis
User interfaces can be tailored to meet the needs of both automated and manual analysis systems. Automated analyzers often have more complex interfaces with advanced features such as built-in diagnostics and real-time data transmission capabilities. These features allow for continuous monitoring and remote management, which is particularly useful for large-scale water management projects.
In contrast, manual analyzers are typically used in field conditions where portability and ease of use are more critical. These analyzers often have simpler interfaces but still require a user-friendly design to ensure accurate data input and interpretation. The interface should be straightforward, with clear instructions and minimal steps required to achieve a valid result.
Future Trends in User Interface for Blue Green Algae Analyzers
Emerging technologies and trends are continually shaping the future of user interfaces for blue green algae analyzers. Some potential advancements include:
- AI and Machine Learning: These technologies can help in real-time data analysis and prediction, providing users with more actionable insights.
Mobile and Remote Access: With the increasing use of smartphones and wireless communication, users can access data and manage their analyzers from anywhere, enhancing the flexibility and convenience of the system.
Enhanced Visualization Tools: Advanced visualization tools can help users better understand complex data, such as 3D models of water bodies with algae concentrations represented in different colors.
Conclusion
The user interface plays a vital role in the effectiveness of blue green algae analyzers. A well-designed user interface ensures that data can be interpreted accurately and efficiently, supporting better environmental monitoring and management. By focusing on intuitive design, clear data visualization, and user-friendly navigation, manufacturers can create analyzers that are not only effective but also easy to use, ultimately contributing to more sustainable and healthier water environments.
At Daruifuno, we specialize in providing high-quality blue green algae analyzers with user interfaces that meet these criteria. Our dedication to innovation and customer satisfaction ensures that our analyzers are reliable, efficient, and user-friendly.
Explore our full selection of blue green algae analyzers
GET IN TOUCH WITH Us
recommended articles
BOQU Instrument focus on development and production of water quality analyzers and sensors, including water quality meter, dissolved oxygen meter, pH sensors, etc.